
Turtle diagram: describing processes clearly for ISO 9001 – including risks and opportunities
What a turtle diagram is, how its six fields relate to ISO 9001 clause 4.4, an example for the purchasing process and how to maintain turtles directly in the process file.
What is a turtle diagram?
The turtle diagram – also called turtle model – describes a process on a single page. The process sits in the middle like a turtle's shell, inputs and outputs are added left and right, and the four "legs" answer the questions With what?, With whom?, How? and How well?. The method comes from the automotive industry and is widely used in ISO 9001 and IATF 16949 audits because it makes a process understandable in minutes.
The six fields
- Inputs – what comes in? Information, material, orders, requirements.
- Outputs – what comes out? Products, documents, decisions, data.
- With what? – resources and systems: software, machines, infrastructure, equipment.
- With whom? – roles: process owner, involved functions, competences.
- How? – methods and documents: procedures, checklists, forms, linked processes.
- How well? – KPIs: measures used to judge effectiveness.
Why this matters for ISO 9001
Clause 4.4 of ISO 9001 requires you to determine for your processes, among other things, inputs and outputs, criteria and methods including performance indicators, resources, responsibilities and the risks and opportunities according to clause 6.1. The turtle diagram covers exactly these points:
| ISO 9001, clause 4.4.1 | Turtle field |
|---|---|
| Determine inputs and outputs | Inputs, outputs |
| Criteria, methods and performance indicators | How?, How well? |
| Resources needed | With what? |
| Responsibilities and authorities | With whom? |
| Risks and opportunities per 6.1 | Addition: risks & opportunities |
With a maintained turtle for every core process, you can answer the typical audit questions on the process approach without hunting for documents.
Example: turtle for the purchasing process
| Field | Content |
|---|---|
| Inputs | Purchase request, specification, approved supplier list |
| Outputs | Purchase order, inspected goods receipt, supplier evaluation |
| With what? | ERP system, supplier portal, inspection equipment at goods receipt |
| With whom? | Purchasing (process owner), requester, quality assurance |
| How? | Purchasing procedure, goods receipt checklist |
| How well? | On-time delivery, complaint rate, order lead time |
Plus as a risk: "single supplier fails" (high) with the action "qualify a second supplier"; as an opportunity: "bundle framework agreements" (medium).
Common mistakes
- Too detailed: a turtle is a profile, not a procedure. Details belong in the linked document.
- Empty KPIs: "How well?" is often left open. Without a KPI, effectiveness cannot be shown.
- People instead of roles: names go out of date. Enter roles; people change.
- Dead text: a turtle pointing to documents that were replaced long ago does more harm than good in an audit.
Turtles in Power QMS for Teams
In Power QMS for Teams the turtle is part of every process file – under Processes → Details → Turtle.
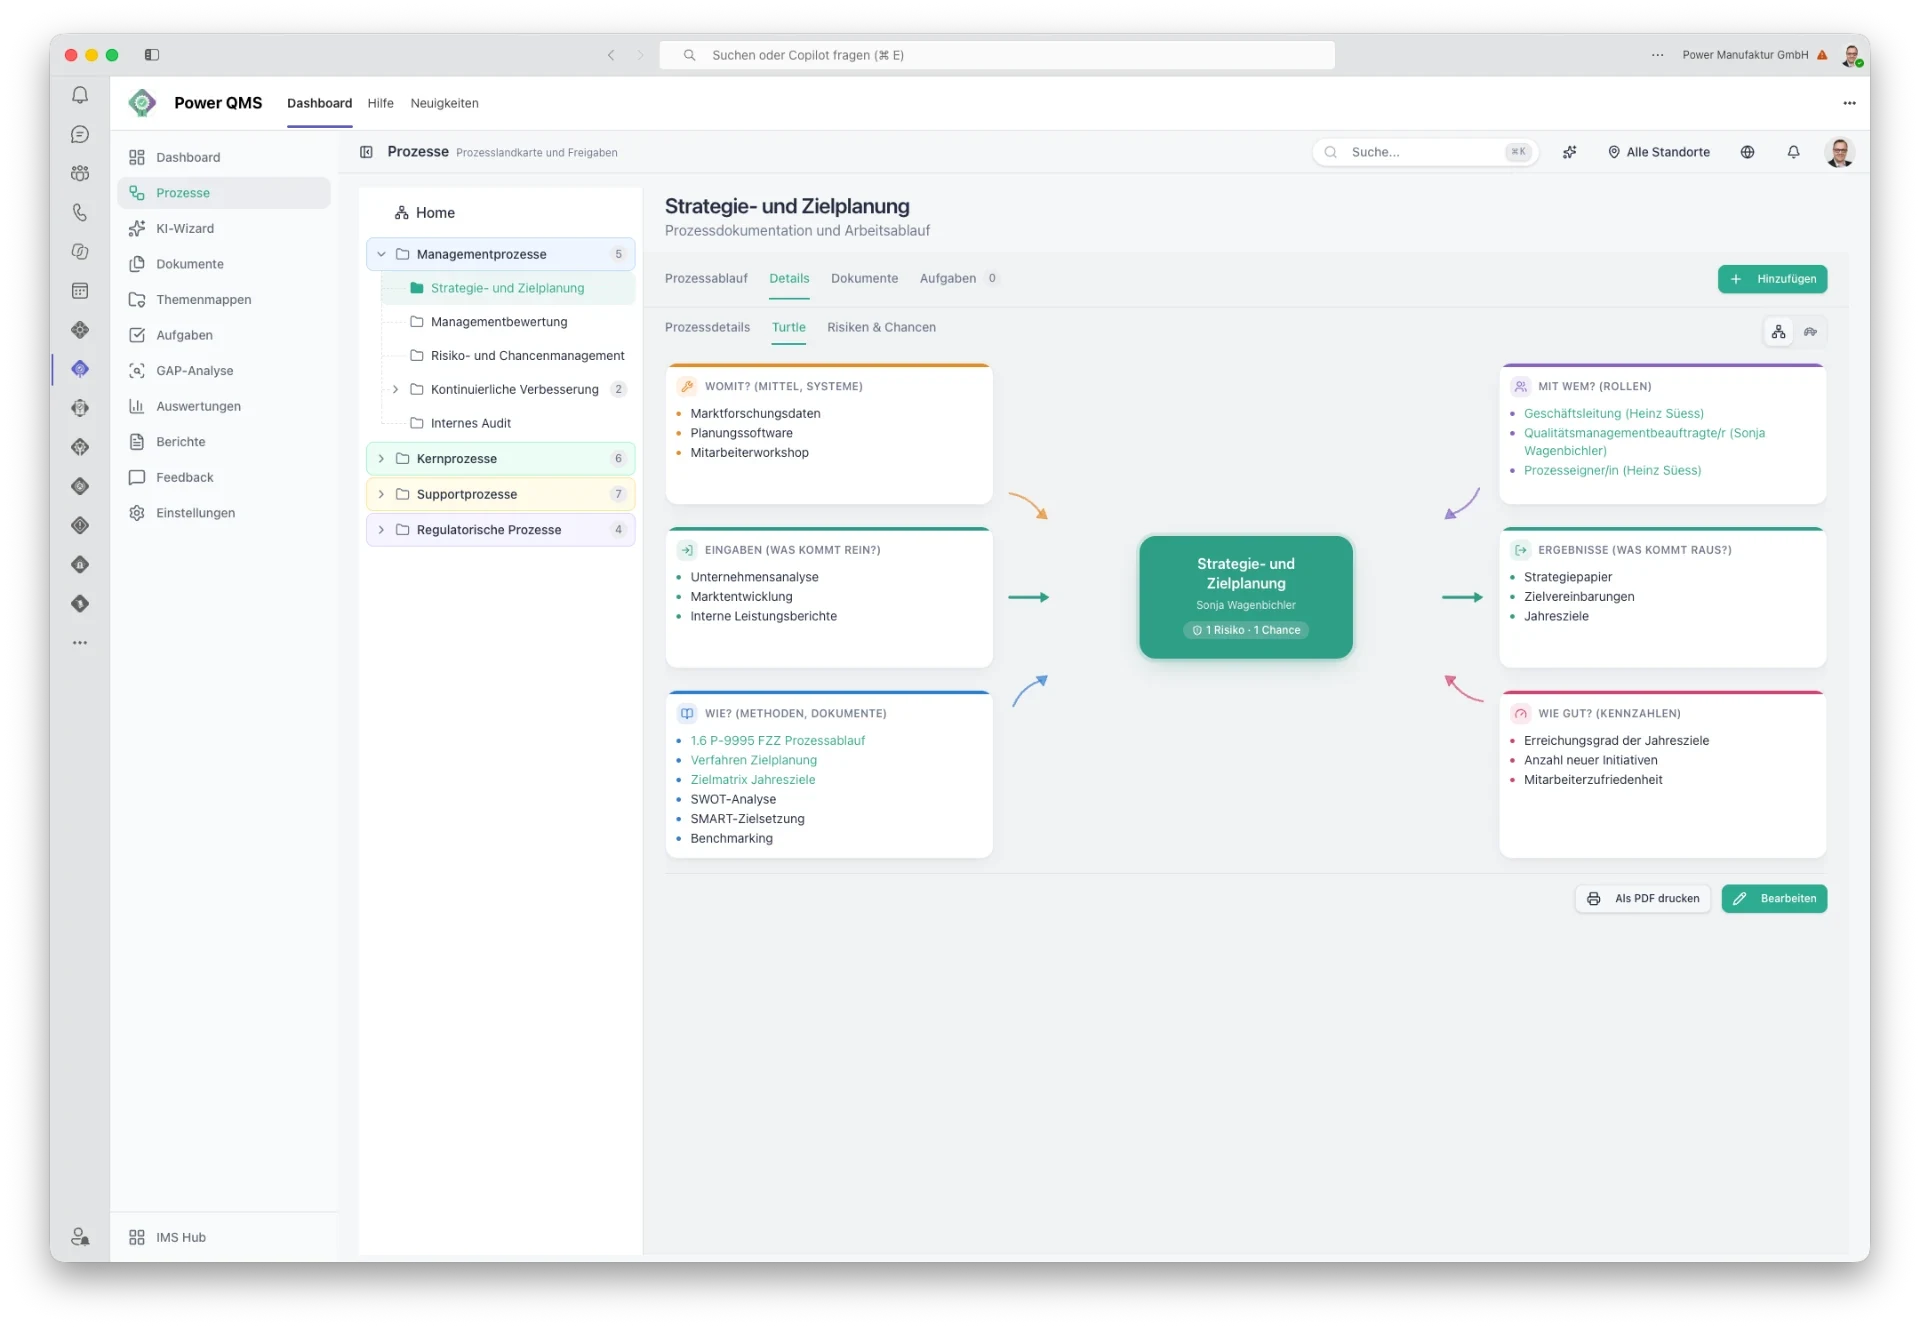
- Two views: either as diagram view or turtle view, printable as PDF.
- Clickable references: "How?" links published documents and processes, "With whom?" links roles from the role model. Because only published content is linked, the turtle always points to valid versions.
- Resources & systems catalogue: for "With what?" you maintain a reusable catalogue with link and description in the master data.
- Completeness at a glance: the app shows how many of the six fields are still open.
- AI suggestions (optional): "Suggest with AI" only adds missing entries and overwrites nothing. You review and save.
- With starter data: the sample process map includes pre-filled process turtles – a good starting point.
- Can be hidden: administrators can hide the turtle under Settings → App settings if you do not use it.
Risks and opportunities per process
Under Processes → Details → Risks & opportunities you record risks and opportunities for each process with a rating of low, medium or high, an action and optionally a document reference. Under Analytics → Risks & opportunities you see all processes in one overview with filter and CSV export – for audits and the management review.
The assessment is deliberately qualitative and so meets what ISO 9001 clause 6.1 requires. For calculated risk analyses with a risk matrix, the Power Risk module is available.
Conclusion
The turtle diagram makes the ISO 9001 process approach tangible: six questions, one page, clear responsibility. It becomes truly valuable when the turtle is linked directly to your controlled documents instead of ageing as a separate slide.
Want to see your process map with turtles? Book a meeting or discover Power QMS for Teams.
Matching modules

Keep reading
Ready for the next step?
Book a free 30-minute consultation – we discuss your requirements and show what is possible with Power IMS.